Archive for the ‘Benchmarks’ Category.
April 27, 2014, 12:48 am
First off I have no idea what made me want to test this…likely because it was easy to script and let run a few times while I went off and did other things.
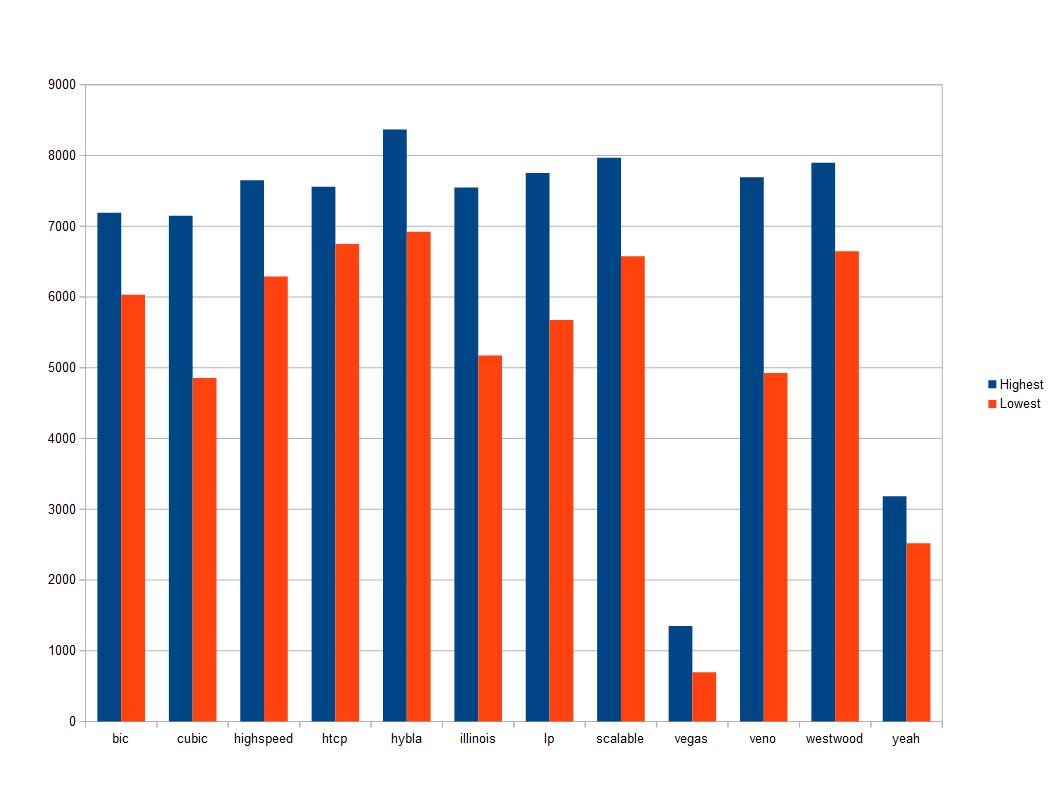
What I am doing is testing network bandwidth between two KVM VMs on a single system using a bridge, the virtio network driver, and CentOS 6.5 as the Client and Host OS.
A little info on how to reproduce this. To find what your system supports you run
ls /lib/modules/`uname -r`/kernel/net/ipv4/
and look for tcp_* to see what to populate in the script….
Then take 30 seconds to write a little for loop(s) with these ….
#!/bin/bash
LOG=$LOG_PATH

#Clear Log....
echo "" > $LOG

for i in cubic bic highspeed htcp hybla illinois lp scalable vegas veno westwood yeah; do
    for s in {1..10}; do
        echo "Testing with : $i" >> $LOG
        echo "Run $s" >> $LOG
        iperf -Z $i -c sec01 >> $LOG
    done
done
Results are all in Mbps and are based off 20 total runs almost back to back. These are VERY inconclusive but at least warrants more testing.
UPDATE – I am doing more testing and found that the longer run times (120 seconds vs 10) is showing MUCH more consistent numbers.
It appears that vegas and Yeah dont like the way these local bridged networks handle cwnd’s and ssthresh among other things.
It also might be worth further testing to see how/if these affect RTT among other network variables.

December 18, 2013, 3:45 pm
This little script (sorry for the formatting..I really need to clean up these scripts in worldpress) can start the debug process for slow DNS queries. It could also be used, witn a little work, to populate a graph if you see frequent issues.
#!/bin/bash
NS=$YOUR_NAME_SERVER_HERE
DOMAIN=Domain your testing with
for i in {1..100} ; do
   dig @$NS $DOMAIN | awk -F: '/Query/ {print $2}';
   sleep 1 ;
done
A server under load will be all over the place. I recently helped someone with this issue where a nameserver was going into swap and was causing VERY slow (900+ ms) NS lookups. I start with a domain the server is auth for as that should be fastest and have the lowest network load but if you dont know any be prepared for a slow response or two as the server populates its cache.
Here is what I saw from a test on a non-auth domain for a server that is local:
 151 msec

 0 msec

 0 msec

 1 msec
and for a domain that the server is auth for…
 0 msec

 0 msec
and against a remote DNS server at google…
 101 msec

 26 msec

 27 msec

 25 msec

 24 msec
I have begun building on this to help troubleshoot further as to where the latency exists. Just a quick 5 min hack I did that helped someone that might help someone else.
November 17, 2009, 5:17 pm
I got the chance to finally do some benchmarking on the new X5550 Xeons. Here is what I came up with using sysbench.

System:
CPU:2x X5550 Xeons (8 cores)
RAM: 16G
Hardware Vendor (Model): Dell (R510)
OS: CentOS release 5.4 (Final)
Kernel : 2.6.18-164.6.1.el5 x86_64
HardDrive(s): OS - Raid 1  / /var/lib/mysql Raid10
Harddrive Controller: Perc6

my.cnf
innodb_log_group_home_dir=/var/log/innodb_logs
innodb_log_file_size=256M
innodb_log_files_in_group=2
innodb_buffer_pool_size=6G
innodb_additional_mem_pool_size=60M
innodb_log_buffer_size=4M
innodb_thread_concurrency=0 #As of MYSQL 5.0.19 0 makes this unlimited
innodb_file_per_table=1
innodb_flush_log_at_trx_commit=2 #Risky but not a worry for this customer due to mainly static data.

Sysbench Command :
sysbench --test=oltp --db-driver=mysql --num-threads=16
--mysql-user=root --max-time=60 --max-requests=0 --oltp-read-only=on

Test Result (subsequent tests were withing a small percentage of this resulte)
OLTP test statistics:
    queries performed:
        read:                            4457866
        write:                           0
        other:                           636838
        total:                           5094704
    transactions:                        318419 (5306.75 per sec.)
    deadlocks:                           0      (0.00 per sec.)
    read/write requests:                 4457866 (74294.56 per sec.)
    other operations:                    636838 (10613.51 per sec.)
Test execution summary:
 total time:                          60.0026s
 total number of events:              318419
 total time taken by event execution: 958.0739
 per-request statistics:
 min:                                  0.98ms
 avg:                                  3.01ms
 max:                                334.80ms
 approx.  95 percentile:              10.86ms

Threads fairness:
 events (avg/stddev):           19901.1875/1010.54
 execution time (avg/stddev):   59.8796/0.03

sysbench --test=fileio --max-time=60 --max-requests=1000000  --file-num=1 --file-extra-flags=direct --file-fsync-freq=0
--file-total-size=128M --file-test-mode=rndrd run
sysbench 0.4.10:  multi-threaded system evaluation benchmark  Running the test with following options: Number of threads: 1  Extra file open flags: 16384 1 files, 128Mb each 128Mb total file size Block size 16Kb Number of random requests for random IO: 1000000 Read/Write ratio for combined random IO test: 1.50 Calling fsync() at the end of test, Enabled. Using synchronous I/O mode Doing random read test Threads started! Time limit exceeded, exiting... Done.
Operations performed:  910652 Read, 0 Write, 0 Other = 910652 Total
 Read 13.895Gb  Written 0b  Total transferred 13.895Gb  (237.15Mb/sec)
 15177.50 Requests/sec executed